Development of a Rapid Prototyping COVID-19 Geographic Information System and the Influence of Testing Centers on Data Visualization
Project Overview
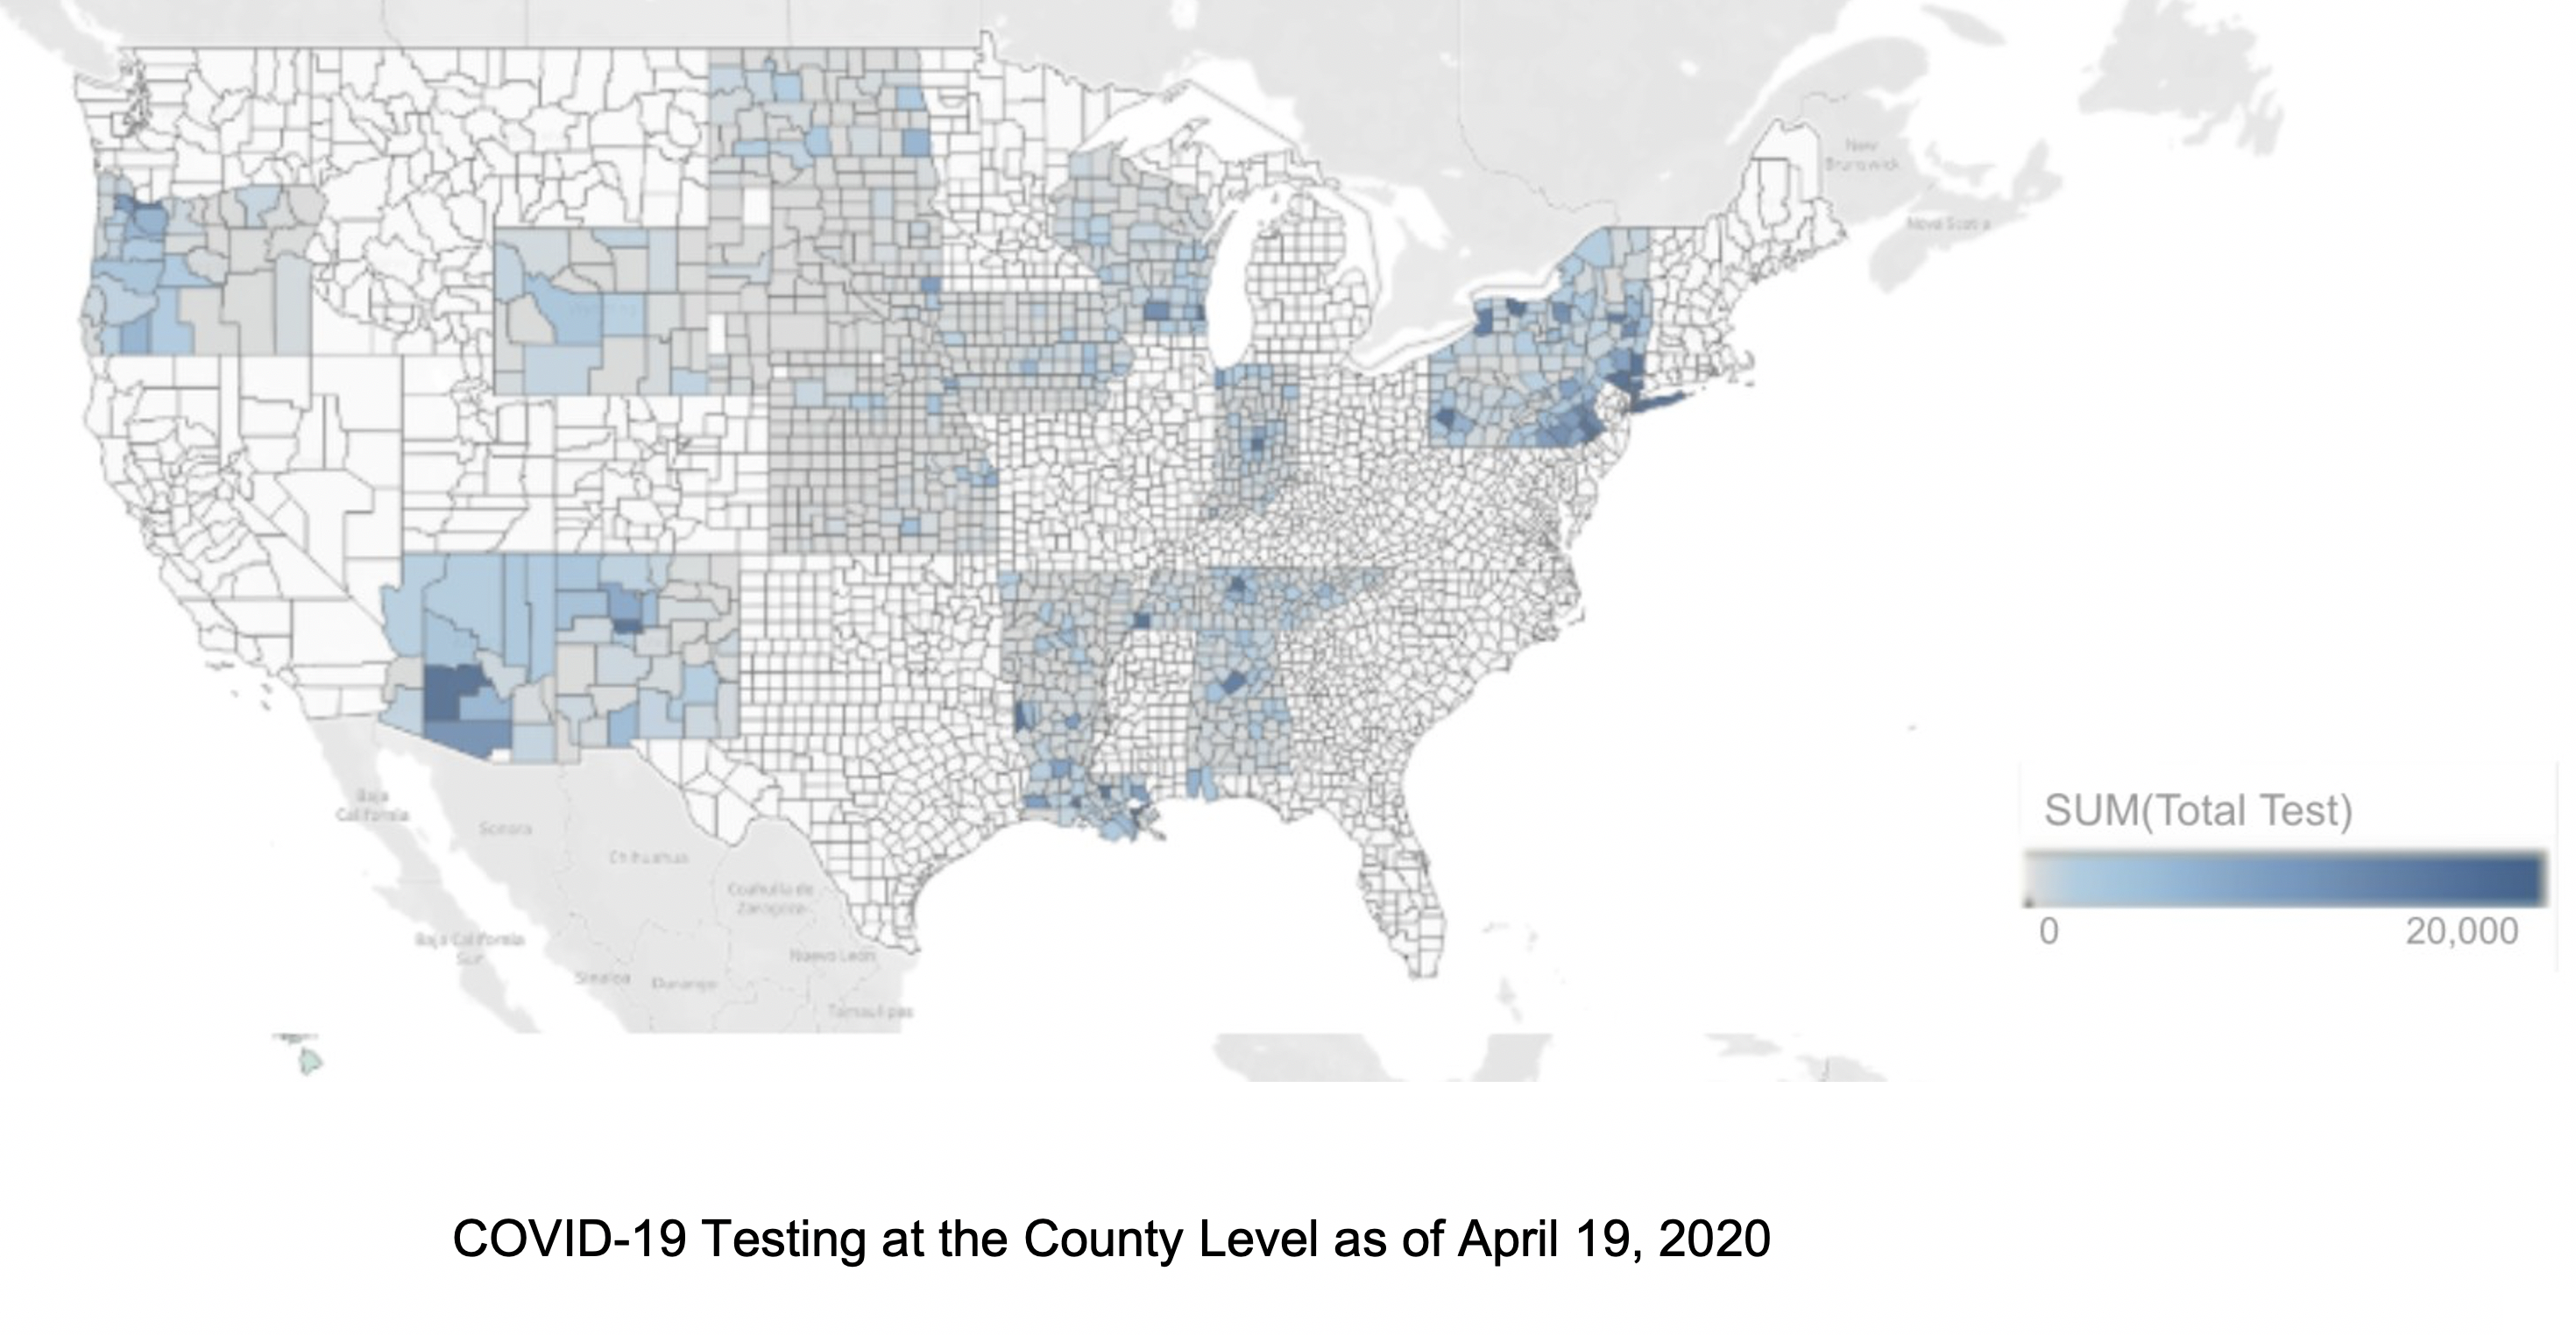
Federal, state, and local governments have been tracking the spread of the COVID-19 pandemic, an infectious disease caused by a coronavirus. As a result of this pandemic, a consistent stream of health data has been produced that tracks the state of health for the seven billion plus people in the world each day, much of which has been publicly released. This open-source data can be used to analyze, visualize, and explain the spread of COVID-19. Here, a COVID-19 information system was created with the business intelligence software Tableau utilizing big data analysis techniques to contribute to general knowledge about the global pandemic. At a state level, data was collected from the big data initiative, the Covid Tracking Project. At the county level, if not provided in a downloadable format, the data was transcribed into a comma-separated values (CSV) file format and used for analysis. Data collection, cleaning, merging, and filtering was a time consuming and tedious task. The COVID-19 pandemic and increased amount of data collection has highlighted the need to perform rapid data analysis and visualizations. Tableau was used for the rapid prototyping of information system. The available data was decentralized and showed the lack of consistency and lack of nation-wide standardization in collecting COVID-19 data. Uncertainties in the data could be reduced through emphasizing how not all states release the same information, as well as efforts for transparency with how published statistics are calculated. The work aims to draw attention to the need for standardized data collection and the viability of using software such as Tableau for the creation of rapid visualizations.
This paper was published in ACM ICMHI ( International Conference on Medical and Health Informatics) in May, 2021 in Kyoto, Japan.
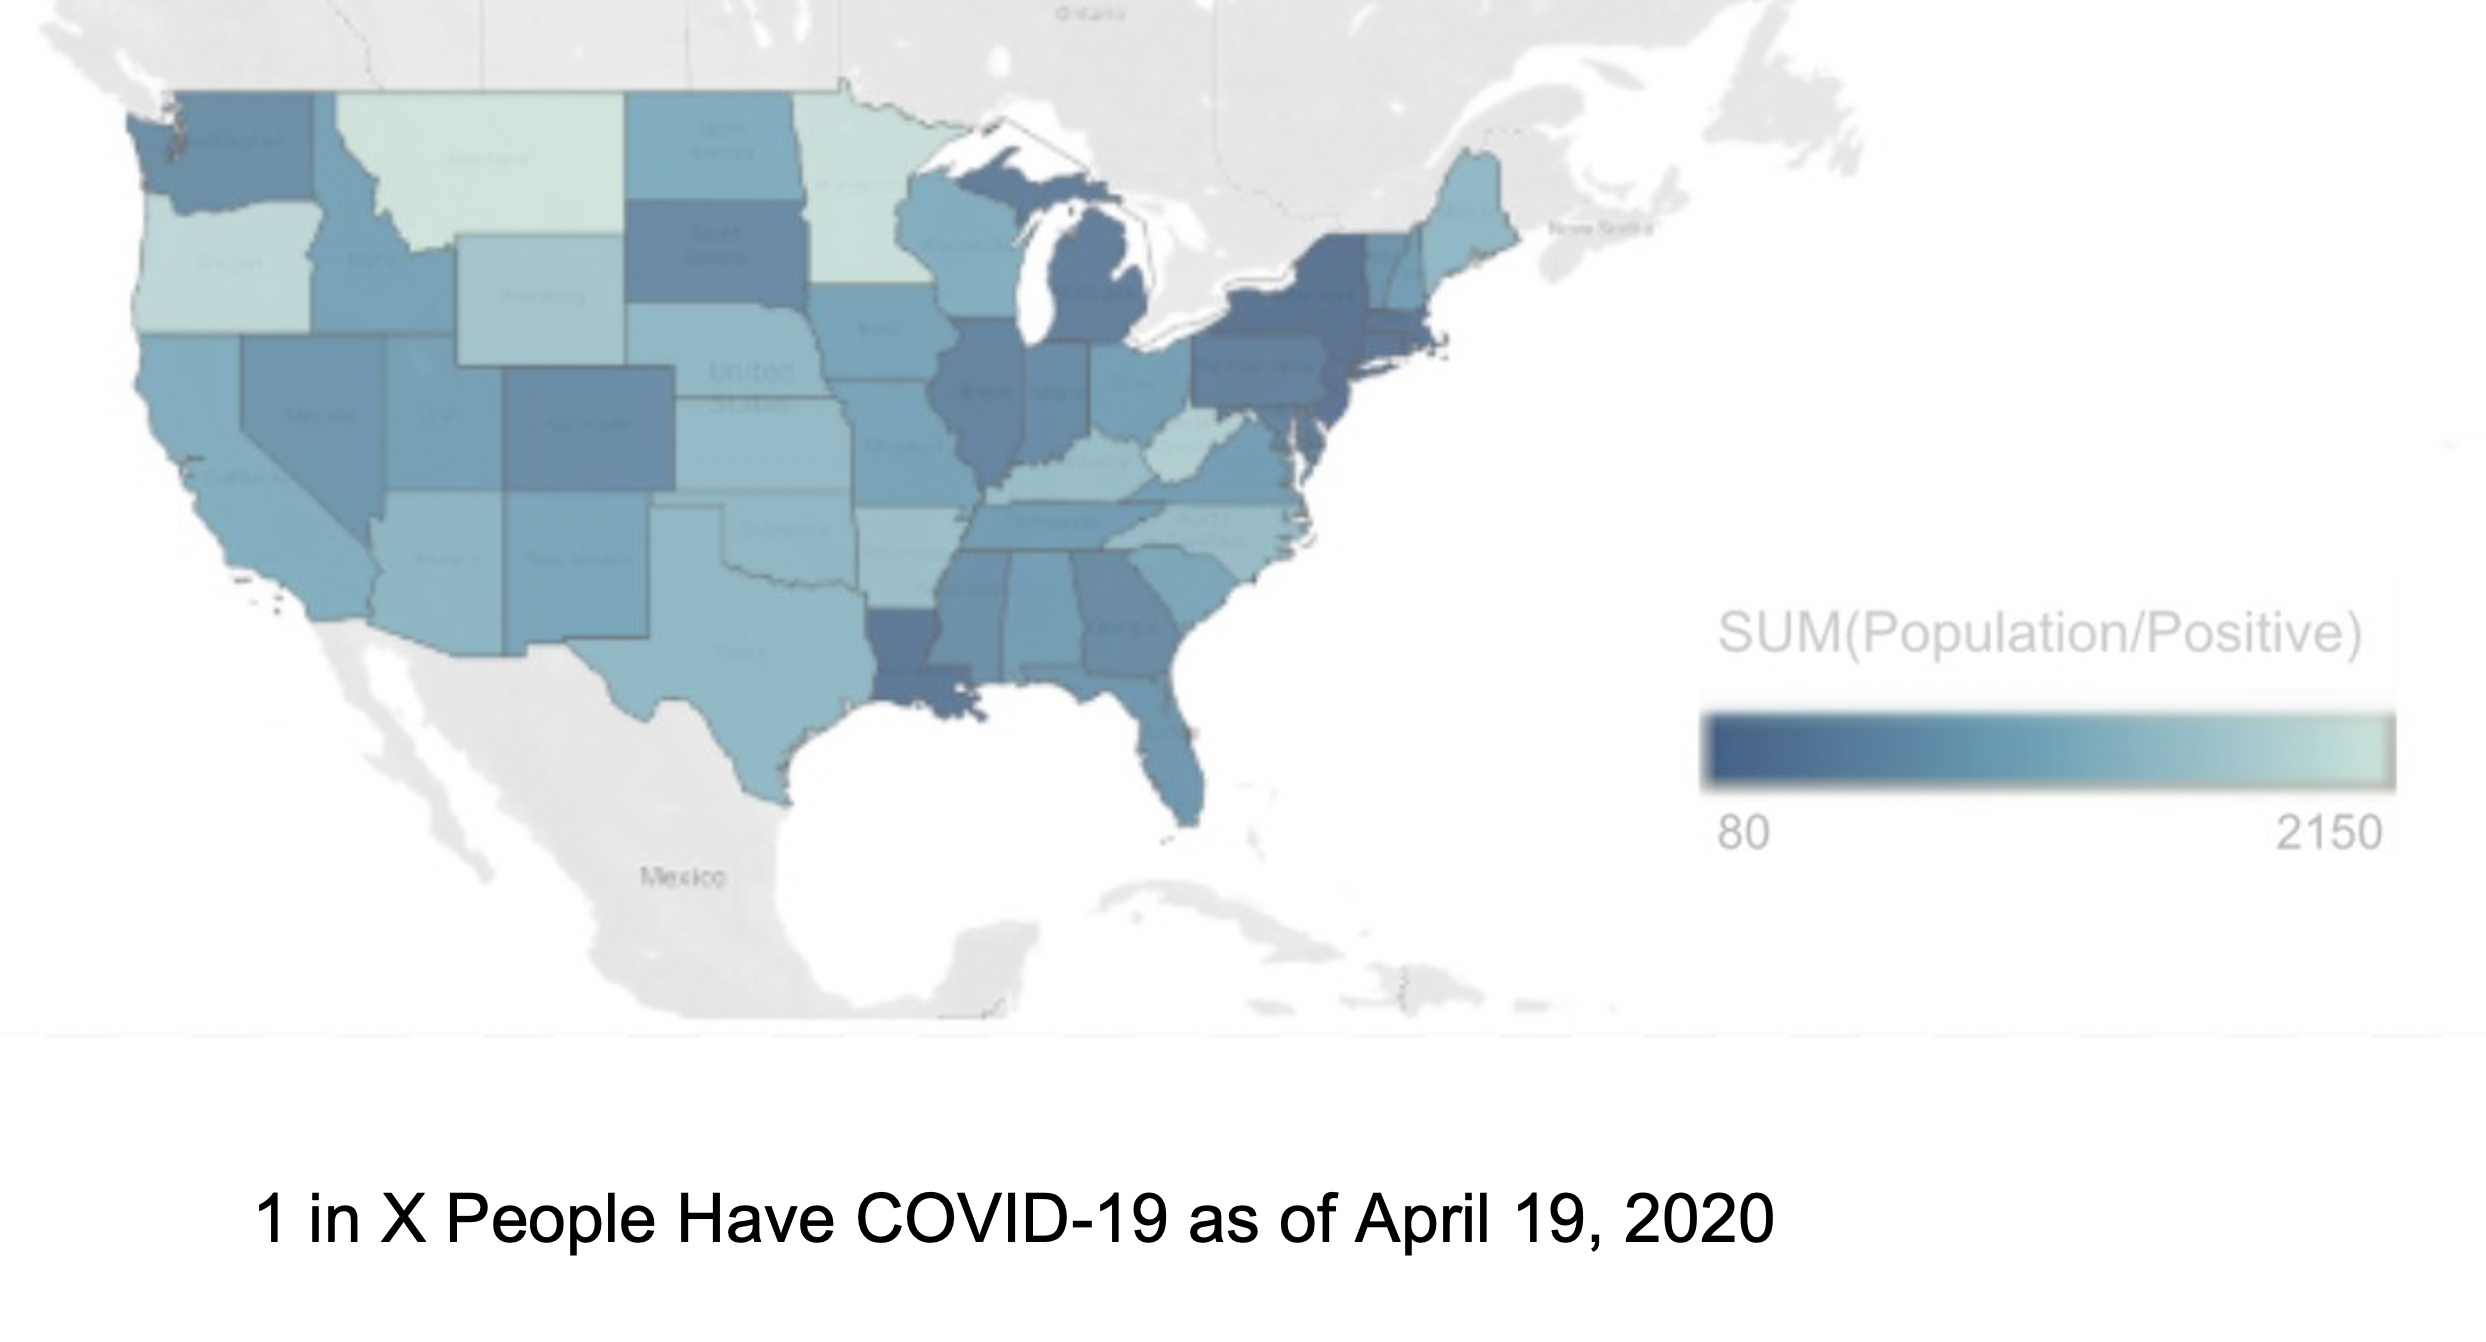
1 in X people have COVID-19, As of April 19th, 2020
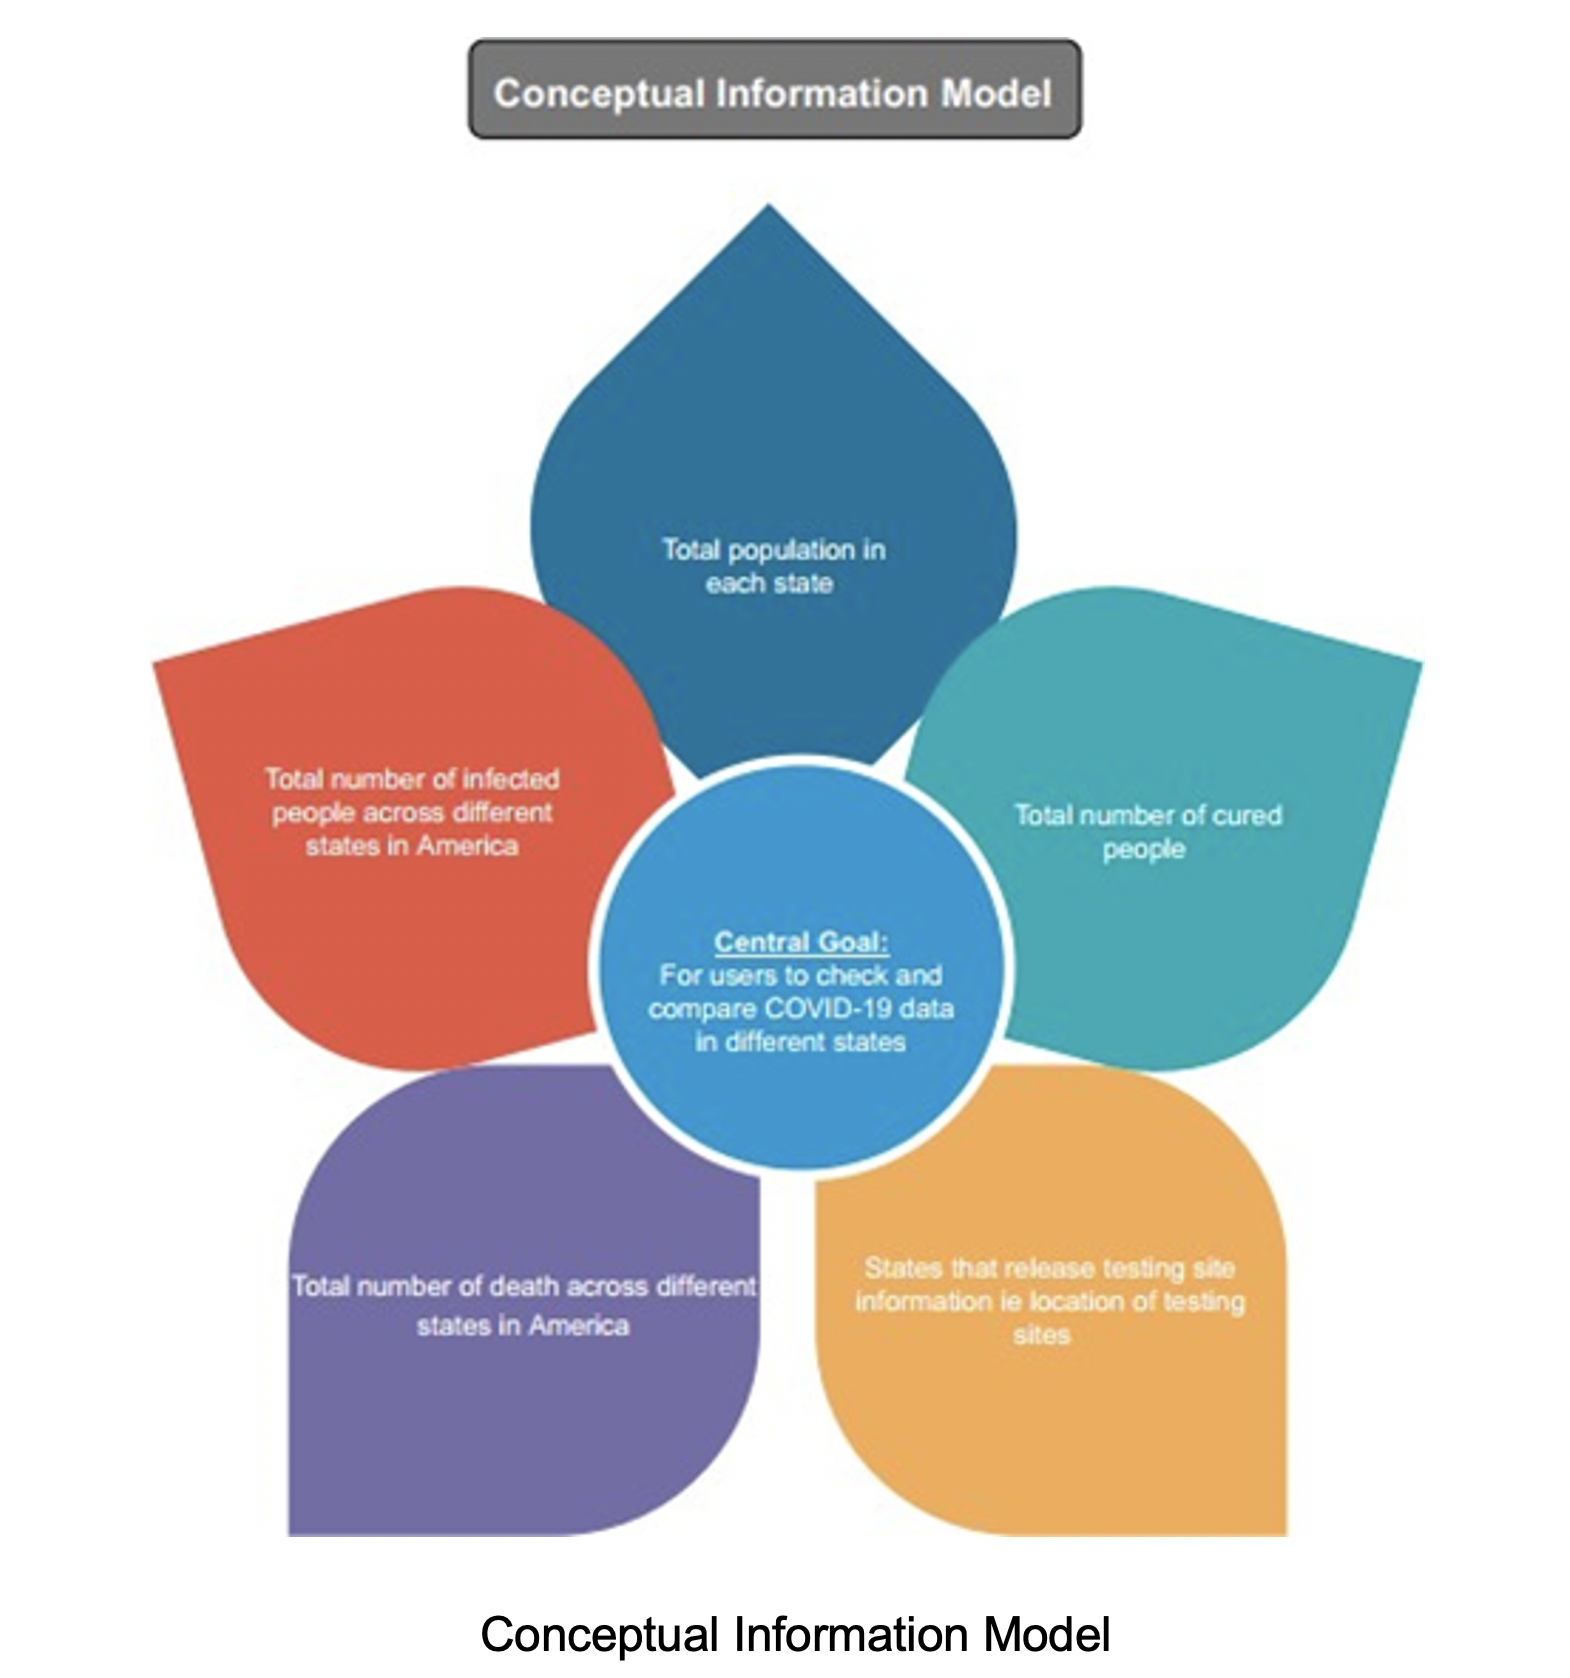
Conceptual Information Model
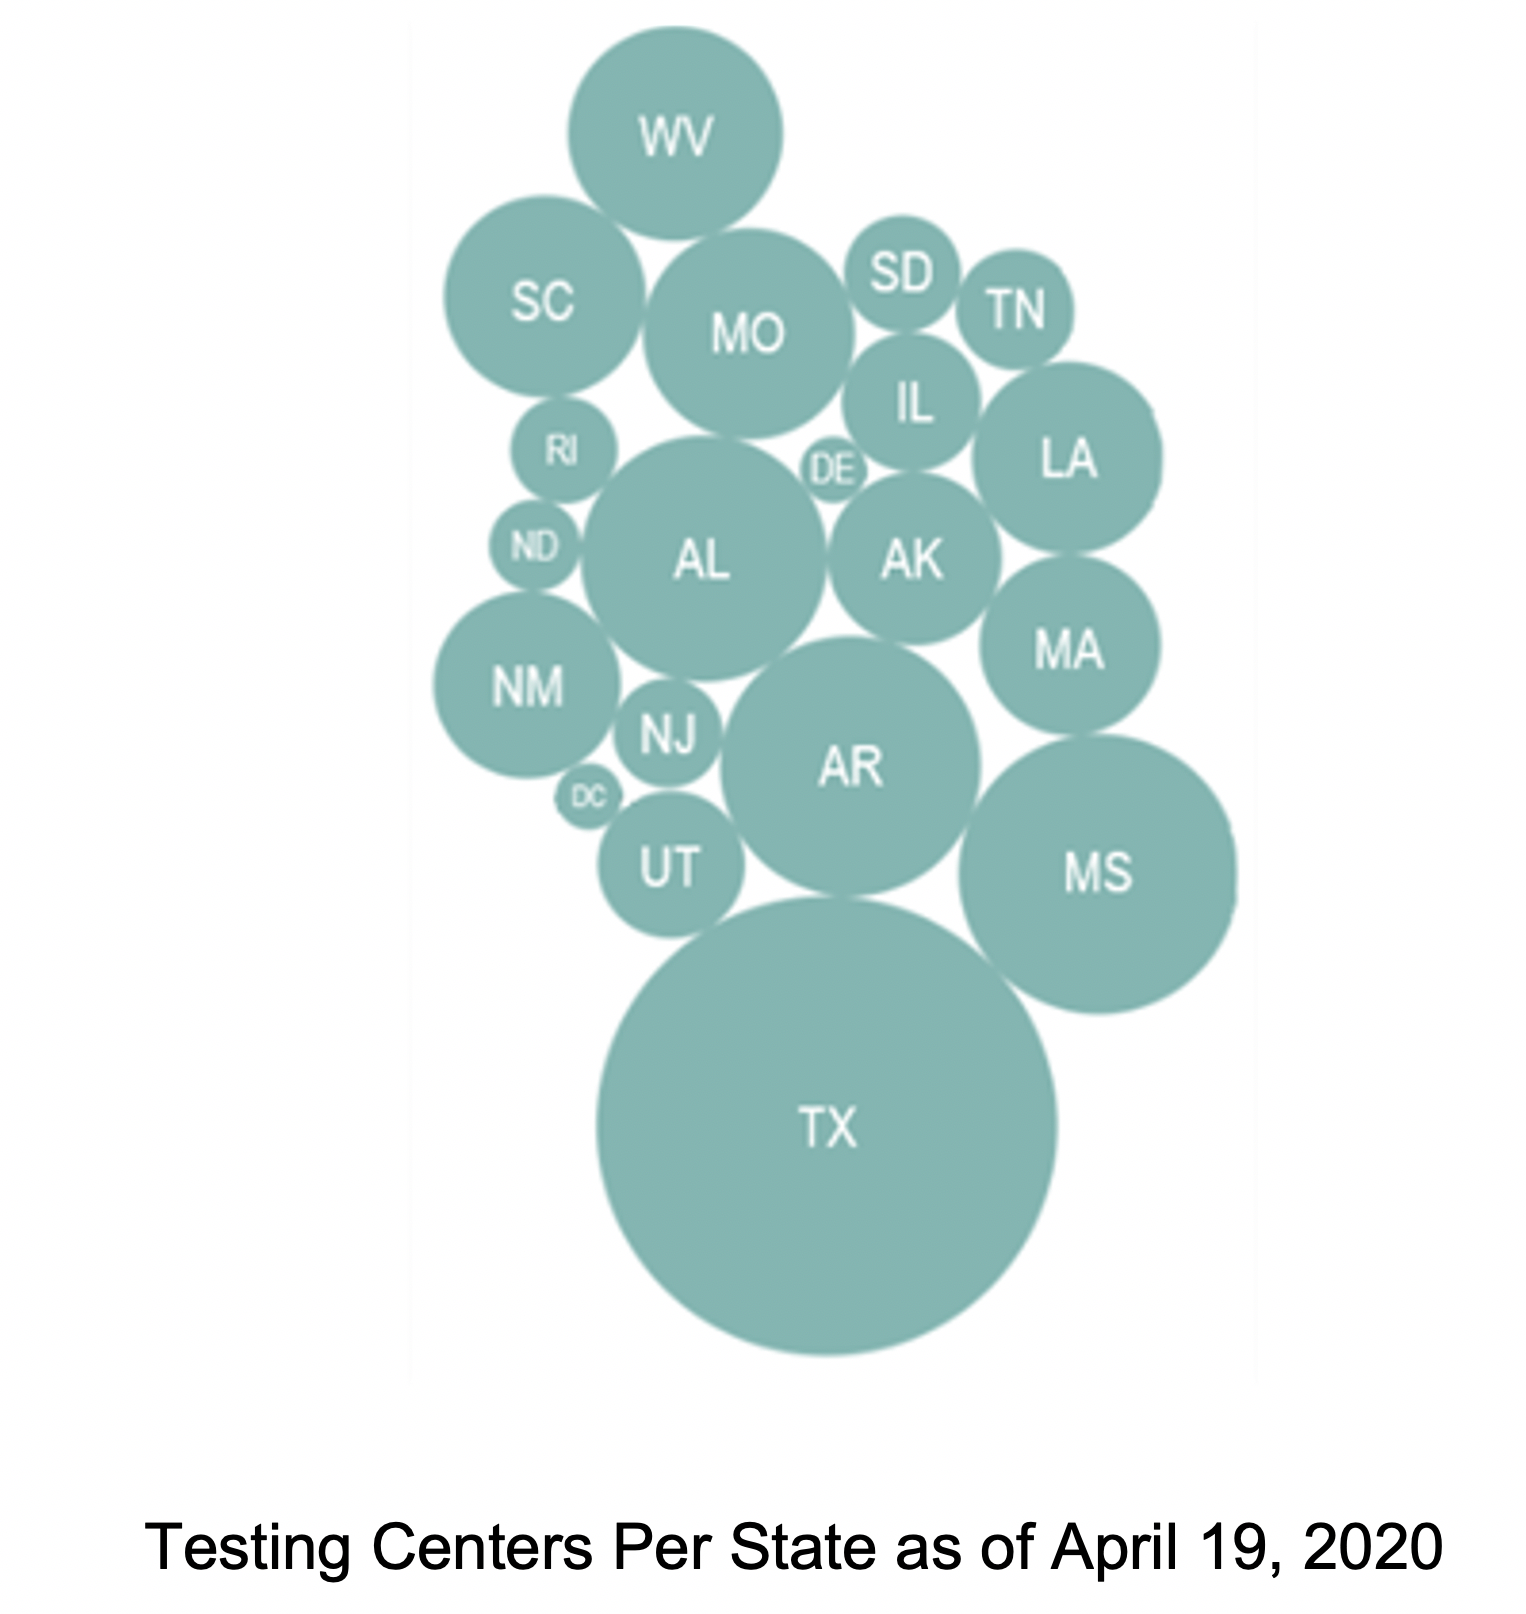
The conceptual information model shows how a user can find and compare testing centers in different states in the United States. The main object for the model is a series of visualization maps that show comparisons of COVID-19 cases and severity of cases between states and even counties. In addition to the main information model, there are several subtopics such as: